Menu
-
Our Council, Our Region
Discover more about the Otago region, the Otago Regional Council, and the councillors who represent you.
-
Managing our Environment
Our environment is our most important asset. We work with the community to ensure the sustainable use of our natural resources. The future of our beautiful region starts with protecting and caring for it today.
-
Rates
Residents of Otago are a key contributor to our funding through rates. Find out more about what rates are used for and how to pay them.
-
Consents and Compliance
We work with the community to promote the sustainable management of natural physical resources. The Resource Management Act sets out how we should manage our environment and forms the foundation for the majority of our work.
-
Plans, Policies, Reports
Publicly released publications, plans and reports from Otago Regional Council. Includes the latest research and data from our scientists, as well as historical council documents.
-
News and Events
View the latest news and events from Otago Regional Council.
-
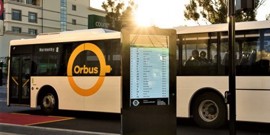
Public Transport
We provide bus services in Dunedin and bus and ferry services in Queenstown to help you get to where you need to go.