Sea Surface Temperature (SST) has been measured daily at Portobello Marine Lab since 1953.
To measure the temperature we use a Perspex tube containing a thermometer. The tube has a rubber flap at the bottom end. When the tube is dipped in the surface water by our jetty, the tube fills up. When we pull it out the flap seals the water inside the tube so we can allow time for the thermometer to stabilise before taking the reading.
The graph presents the data from 1953 to end of 2017.
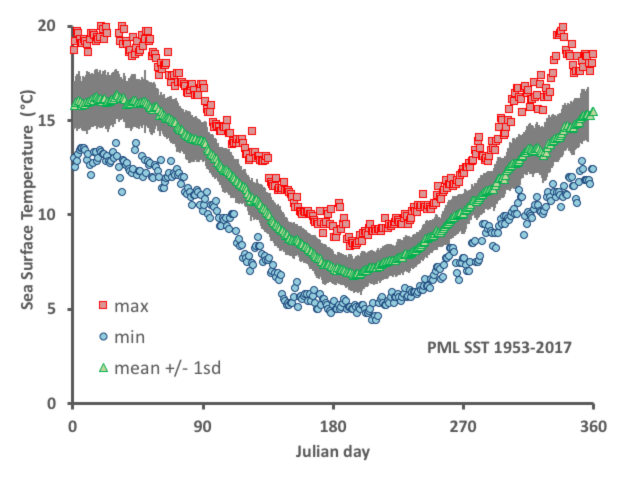
For ease of some calculations we give every day in a year a number from 1 on 1st January to 366 on 31st December (this includes leap years).The first feature that stands out is the regular and (seemingly predictable) curve that means for a given Julian-day of the year, we can take decent guess at the SST. By Julian day I mean a date like 5 November or 14 February.
The green triangles represent the average for each given day. That is, each 5 November is compared only with other 5 Novembers.
The grey bars on either side of the green triangles are +/– one “standard deviation” for that day. A standard deviation is a way of showing the variation between the data that go into the mean. A small standard deviation means the values were all very similar.
The red squares give the maximum ever recorded for a given day, the blue circles are the minimum.
For a given day the summer range is 6-7 °C, winter range is little narrower 5-6°C. Compare this to 14 February, where the observed SST has been anywhere from 12.1 to 19.2 °C.
Is it warming? To answer this, we look at a long-term average (internationally 1960-1990 is used). Then we calculate the ‘anomaly’ for a given day. This is the difference from the long-term average. So, if the average SST for 5 Novembers from 1960-1990 is 13.0 °C and in 2017 it was measured as 16.1 then we would say the 2017 anomaly for 5 November was 3.1 °C. As predicted by theory, our data doesn’t really show any signs of warming in the summertime. However, winter data shows about 1.3 °C warming.
For more detail see a paper by University of Auckland researchers, described in the ODT of 9 November 2017 https://www.odt.co.nz/news/dunedin/warmer-southern-waters-may-affect-fisheries-wildlife