-
-
-
-
-
Soil health monitoring
-
-
-
-
-
-
-
-
-
-
-
-
-
-
Soil health is the continued capacity of a soil to function as a vital, living ecosystem that sustains plants, animals, and humans [1]
We rely on three main soil functions:
- Food and fibre growing – soil is the anchor for plants, providing nutrients and water.
- Environmental cycling – soil controls water movement, purifies contaminants, and exchanges atmospheric gases.
- Habitat for life – soil is home to more than half of all species on the planet.
Preserving soil and its health is important because it is critical for our survival and can be degraded or lost. As soil is lost or degraded faster than it forms, it is generally considered to be a non-renewable resource over human timescales [2].
Soil health is strongly affected by how it is managed, and it can be difficult or even impossible to reverse any loss of functions. Monitoring soil to understand when it is at risk and needs protection helps to safeguard this key resource.
If you would like to assess the soil of your own land, you can use the Landcare Research Visual Soil Assessment to assess your soil health using simple field-based tests. This is a great tool that was developed in Aotearoa New Zealand for farmers.
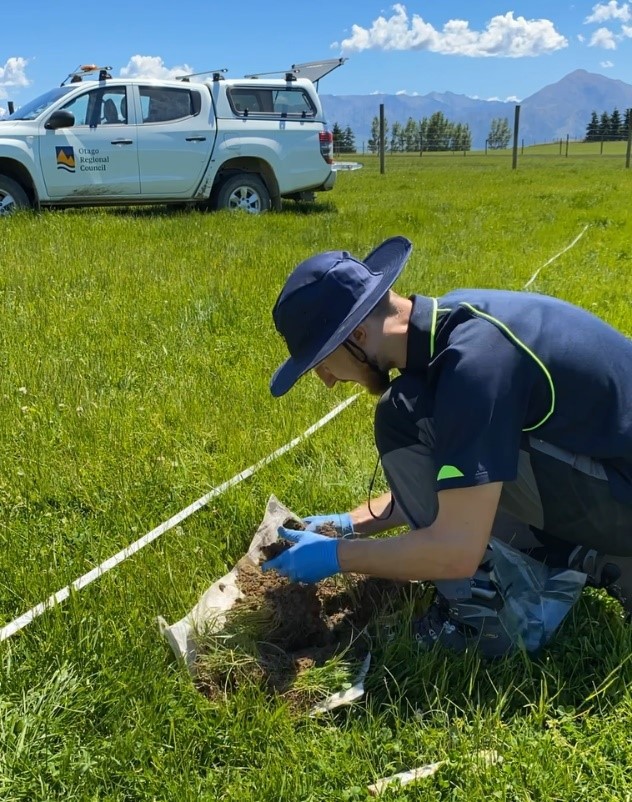
This is a national long-term monitoring programme of the soil resource to ensure it can continue to provide for us and generations to come. It is intended as a ‘warning system’ to identify key areas and soils at risk. The programme is run in parallel with other Regional Authorities across the country following the same methodology [3, 4]. The requirement to monitor and report on soils is set out in the Resource Management Act (1991). The collected information is reported for regional and national evidence-based decision-making.
Locations across Otago were chosen to represent the different soil orders, land uses and other characteristics of our region (climate, geology, slope, elevation, vegetation cover). These locations are re-visited every five years to track changes over time.
The best way to measure soil health is debated and depends on the perspective, so assessing it in one test is almost impossible. Several tests are usually needed to get an overall indication of the health of soil. At each location, soil samples are taken to test for seven soil indicators and whether they meet the target ranges set in the National Environmental Monitoring Standard [4].
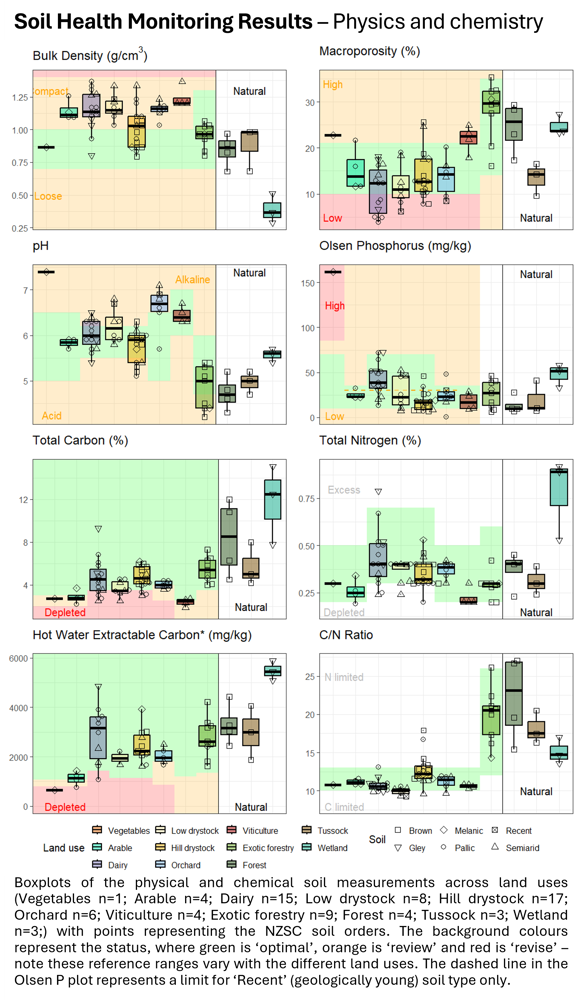
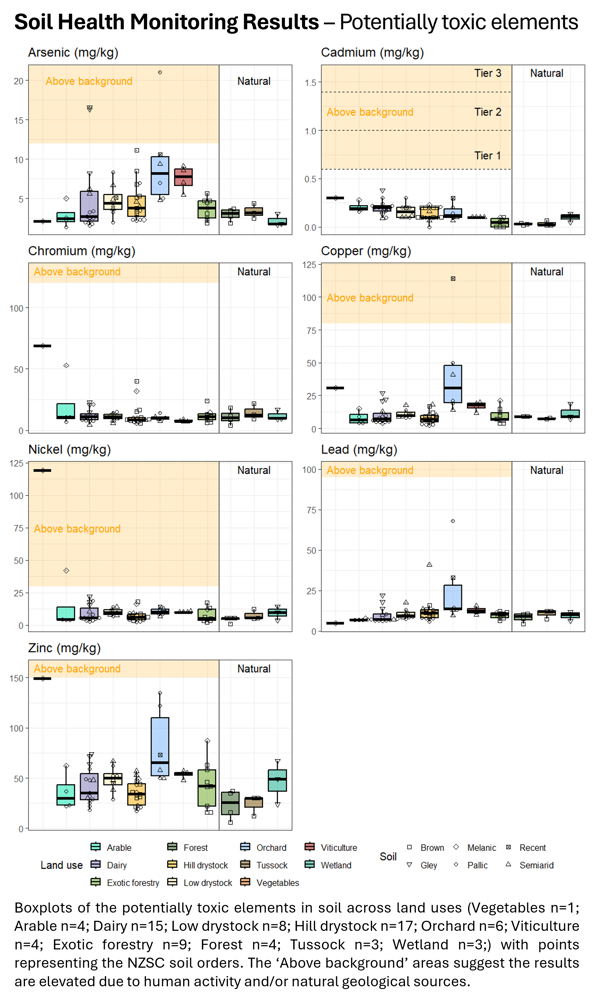
The core soil health indicators used in the programme and what they mean.
| Type | Indicator | What it means |
|---|---|---|
| Physics | Bulk Density | A high bulk density relates to the compaction of the soil, which can limit plants access to water and nutrients in the soil and increase surface water runoff. A low density means the soil will be very loose and could be susceptible to erosion. |
| Macroporosity | Large soil pores allow space for air and water transport through the soil, which is important for plant growth, drainage and aeration. | |
| Chemistry | pH | Dictates the availability of nutrients and the nature of chemical reactions taking place. There is no "correct" pH as plants are adapted to different pH levels. Soil can naturally acidify over time but fertilisers also contribute to lowering the pH. A low pH increases the bioavailability of ions that are toxic to plant roots. |
| Total Carbon (C) | An important energy source for soil micro-organisms involved in nutrient cycling. It is a good indicator for biological activity, fertility and water and nutrient retention. | |
| Total Nitrogen (N) | N is the most commonly limiting nutrient. Total N gives an indication of the N status of the soil. Inorganic N (e.g. urea) is accessible to plants for uptake and organic N (e.g. proteins) can be converted into this by micro-organisms decomposing organic matter. | |
| C:N | Determines the release of plant-available N by micro-organisms. A low ratio means micro-organisms are C limited and so organic matter is decomposed to release N which plants can uptake. A high ratio means micro-organisms are N limited and so they outcompete plants, meaning less N is available to plants. | |
| Hot Water Extractable Carbon (HWEC) | Higher values indicate more carbon that is readily decomposed which is related to greater levels of microbial activity and available N. | |
| Olsen Phosphorus (P) | P is commonly the second most limiting nutrient to plant growth. Low P levels are likely to be limiting plant growth and high P levels increase the risk of P loss to waterways which can impact water quality especially when the P retention of the soil is low. | |
| Potentially toxic elements | Arsenic (As) | Exists at trace levels but is naturally elevated in parts of Otago, particularly where schist-derived soils occur. Anthropogenic sources include CCA-treated timber, historic arsenic-based pesticides, sheep dips, and some alloys. |
| Cadmium (Cd) | Present at trace levels but can be elevated from long-term application of phosphorus fertilisers, which contain impurities. This has led to the Tiered Fertiliser Management System for managing soil Cd. Other sources include batteries, alloys and industrial emissions. | |
| Chromium (Cr) | Occurs at trace levels in most Otago soils, with naturally elevated concentrations in areas influenced by mafic and ultramafic geology. Anthropogenic sources include timber treatment, metal plating, pigments, leather tanning, and industrial emissions. | |
| Copper (Cu) | Present at trace levels but Cu is also widely added through agricultural inputs, especially copper-based fungicides, stock supplements, and pasture topdressing. Other sources include CCA-treated timber, vehicle brake wear, and industrial emissions. | |
| Lead (Pb) | Occurs at trace levels but is elevated in many urban areas due to legacy contamination from leaded petrol, Pb-based paints, industrial emissions, and historic waste disposal. | |
| Nickel (Ni) | Naturally present at trace levels, with higher background concentrations in soils formed from mafic or ultramafic geology. Anthropogenic sources include industrial emissions, metal plating, batteries, and waste disposal. | |
| Zinc (Zn) | Occurs at trace levels but is commonly elevated through agricultural inputs, including Zn-containing fertilisers, stock supplements, and residues from drenches. Other sources include galvanised metal, vehicle tyre wear, industrial emissions, and urban stormwater deposition. |
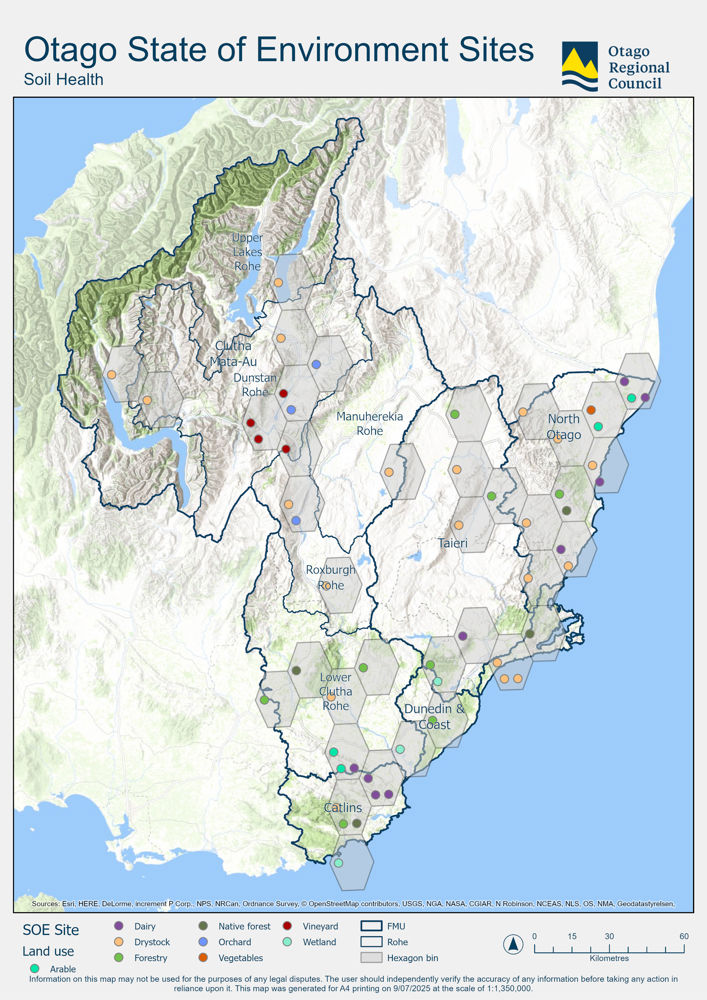
The programme in Otago is expanding to capture more soil and land use types. If you are interested in being involved in the programme or have any questions, send us a message at science.enquiries@orc.govt.nz.
[1] Doran, J.W. and Zeiss, M.R., (2000). Soil health and sustainability: managing the biotic component of soil quality. Applied Soil Ecology, 15, 3-11.
[2] Lal, R., 2015. Restoring soil quality to mitigate soil degradation. Sustainability, 7, 5875-5895.
[3] Land Monitoring Forum, 2009. Land and Soil Monitoring: A guide for SoE and regional council reporting. Land Monitoring Forum, New Zealand.
[4] National Environmental Monitoring Standard, 2022. Soil Quality and Trace Elements. Sampling, Measuring, and Managing Soil Quality and Trace Element Data. Version 1.0.0.


